Launched on April 24, 1990, the Hubble Space Telescope has become one of the most influential instruments in modern astronomy. Orbiting at an altitude of 547 km, it escapes Earth's atmospheric turbulence, offering an angular resolution of about 0.05 arcseconds. Hubble has explored the cosmic past up to redshifts \( z > 10 \), revealing galaxies formed less than a billion years after the Big Bang.
Its WFC3 camera and COS spectrograph have captured light from objects so distant that their visible radiation is now shifted into the infrared according to Hubble's law: \( v = H_0 \, d \) where \( v \) is the recessional velocity, \( H_0 \) is the expansion constant, and \( d \) is the distance to the observed galaxy.
N.B.:
The redshift, denoted \( z \), measures the change in wavelength of a spectral line between emission and observation. It is defined by the relation: \( z = \frac{\lambda_{obs} - \lambda_{emit}}{\lambda_{emit}} \)
A positive redshift (\( z > 0 \)) corresponds to a redshift, indicating that the object is moving away from the observer. Conversely, a negative redshift (\( z < 0 \)) corresponds to a blueshift. On a large scale, the \( z \) values observed for galaxies and quasars are proportional to their distance according to Hubble's law, \( v = H_0 \, d \), a direct signature of the expansion of the universe.
One of Hubble's major missions was the precise measurement of the universe's expansion rate. By observing Cepheids and Type Ia supernovae, Hubble enabled Adam Riess (1969–) and Brian Schmidt (1967–) to obtain a value for the Hubble constant around \( H_0 ≈ 73 \, km·s^{-1}·Mpc^{-1} \).
These results highlighted a tension between local values of \( H_0 \) and those derived from the cosmic microwave background by the Planck satellite, which gives \( H_0 ≈ 67.4 \, km·s^{-1}·Mpc^{-1} \). This disagreement, known as the "Hubble tension," suggests that our \(\Lambda CDM\) cosmological model may need revision.
Hubble revealed the complex structures of nebulae, such as the famous Pillars of Creation in the Eagle Nebula (M16). These images, captured in visible and infrared light, show the dynamic processes of star formation, where winds from young stars shape molecular clouds.
The details of the jets from HH objects or the protoplanetary disks of Orion have helped us understand the mechanisms of accretion and ejection of matter around protostars.
Hubble also contributed to the spectroscopy of exoplanetary atmospheres. By analyzing starlight filtered through the atmospheres of planets during transits, it detected the presence of water vapor, methane, and sodium in several extrasolar worlds.
These pioneering observations paved the way for more recent instruments like the JWST, capable of studying the chemical composition of these atmospheres with greater precision.
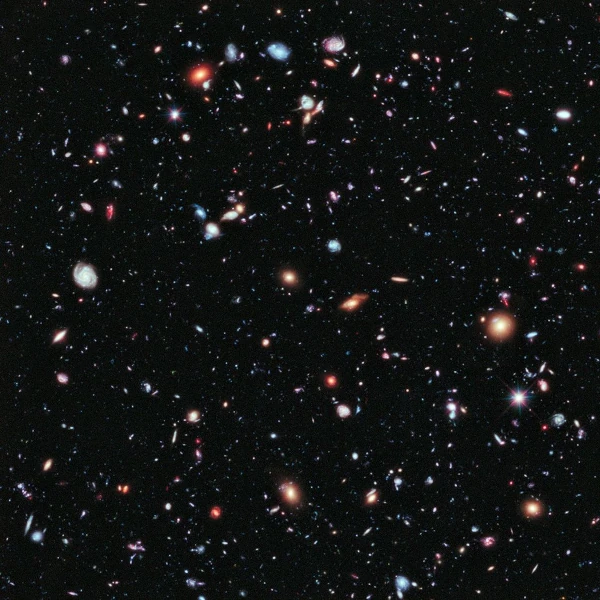
The iconic image of the Hubble Ultra Deep Field (2004) brings together nearly 10,000 galaxies in a tiny field of 11 arcminutes. It illustrates the staggering density of the observable cosmos: each point of light represents an entire galaxy containing billions of stars.
N.B.:
The limiting magnitude reached by the Hubble Ultra Deep Field is \( m_{AB} ≈ 30 \), or objects 4 billion times fainter than those visible to the naked eye.
Despite its age, Hubble remains a cornerstone of space observation. Its data, archived for over thirty years, are still used for research on dark matter, quasars, and galactic morphology. The interaction between Hubble and the James Webb Space Telescope will now provide a complementary view of the cosmos, combining ultraviolet and deep infrared.
| Telescope | Observed wavelengths | Angular resolution | Launch year | Orbit |
|---|---|---|---|---|
| Hubble | Ultraviolet – Visible – Near infrared | 0.05″ | 1990 | Low Earth orbit (547 km) |
| James Webb | Mid and far infrared | 0.1″ | 2021 | Lagrange Point L2 (1.5 million km) |
| Chandra | X-rays | 0.5″ | 1999 | Highly elliptical Earth orbit (10,000 × 140,000 km) |
| Spitzer | Infrared (3–180 µm) | 2″ | 2003 | Heliocentric orbit (Earth-trailing) |
| Gaia | Visible (precision photometry and astrometry) | 0.01″ | 2013 | Lagrange Point L2 |
| Kepler | Visible (planetary transit detection) | 4″ | 2009 | Heliocentric orbit (trailing Earth) |
| TESS | Visible – near infrared | 21″ | 2018 | Highly elliptical orbit (P/13.7 days) |
| ALMA | Millimeter and submillimeter waves | 0.01″ (interferometry) | 2011 | Ground (Atacama Desert, Chile, 5000 m) |
| Fermi | Gamma rays (20 MeV – 300 GeV) | 3′ to 0.1° | 2008 | Low Earth orbit (565 km) |
| Euclid | Visible and near infrared (cosmological mapping) | 0.2″ | 2023 | Lagrange Point L2 |
Source: NASA HubbleSite, ESA, and ADS – Astrophysics Data System.
 How to Spot Starlink Satellite Trains in the Sky?
  AI, the Astronomer's New Eye: From Analysis to Cosmic Prediction
  What the First Images from Perseverance Show Us: The Surface of Mars, As If We Were There
  GRAIL Twin Probes: Mapping the Moon's Hidden Interior
  Earth Under Surveillance: Observation Satellites
 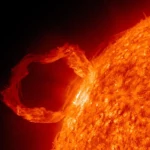 March 2010: The Ring of Fire Captured by the SDO Observatory
 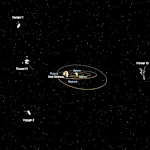 Positions of Space Probes in 2025
  Giants of Observation: The Largest Ground-Based Telescopes
 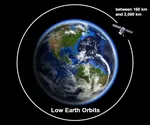 Low Earth Orbits and their uses
 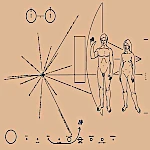 Pioneer, first message to extraterrestrials!
 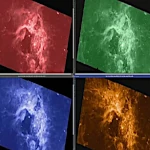 How to see infrared images from JWST?
 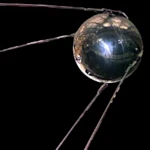 Sputnik 1 and 2: The Dawn of the Space Age
 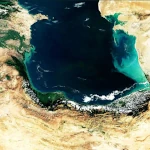 ENVISAT: Ten Years of Uninterrupted Observation of Earth's Ecosystems
 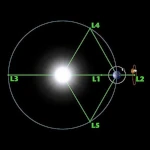 Lagrange Points: Gravitational Gateways of the Solar System
 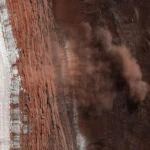 Mars Reconnaissance Orbiter: The Lynx Eye Revealing Martian Secrets
  Kepler: 4,000 Worlds and More, A New Map of the Sky
  Why Measure Space at the Nanometer Level?
 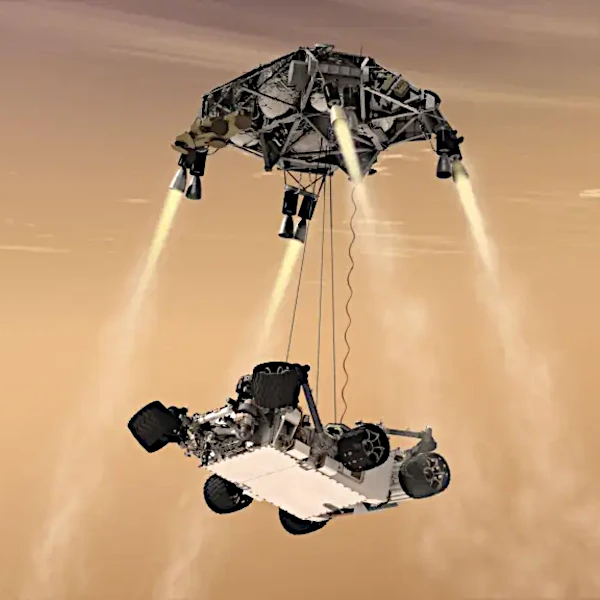 High-risk landing for Curiosity in 2012
  Cheops Space Telescope: A New Vision on Exoplanets
 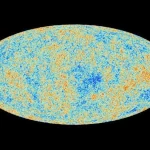 The world of Planck
  Rosetta Space Probe: Comet Churyumov-Gerasimenko
 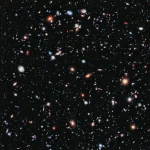 The Hubble Space Telescope: Three Decades of Revelations
 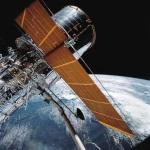 Première photo du télescope Hubble
  Satellites that measure underwater relief
  MESSENGER: The First Probe to Visit the Mysterious Planet
  How GPS Locates Your Position at Any Time?
  The ISS and Beyond? Towards the End of a Space Chapter
  Space Telescopes: Humanity's Eye Beyond the Atmosphere
  Space Probes: Interplanetary Travelers and Beyond
 The GAIA satellite maps the Milky Way
 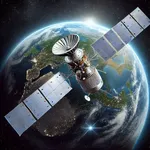 How to calculate the synchronous orbit?
 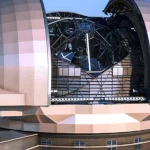 E-ELT: The World's Largest Optical Telescope
 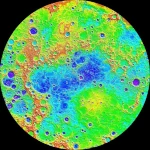 Mercury probes
 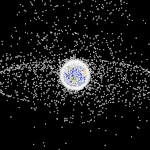 Space Debris: The Nightmare of Modern Satellites
 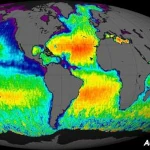 Aquarius: A Mission to Map Ocean Salinity
 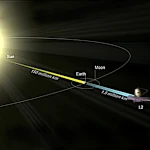 JWST: An Unprecedented Look at the First Lights of the Universe
  METEOSAT: A Key Satellite for Climate Monitoring
 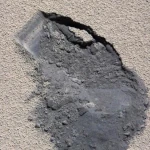 Curiosity, the first shovel, sample of Martian soil
 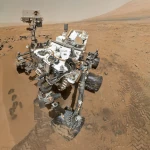 From Mariner to Perseverance: Successes and Failures of Mars Probes
 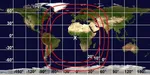 Where is the geostationary orbit?
 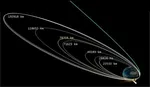 MOM, the technological demonstration
 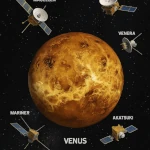 Venus under surveillance: an overview of space probes
 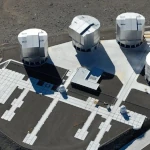 What Is an Astronomical Interferometer?
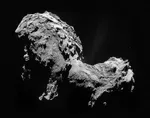 The Philae Robot and the Rosetta Comet
 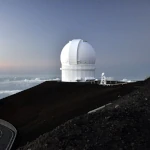 Mauna Kea Under the Stars: The CFHT Telescope in Pursuit of the Universe's Mysteries