


Aquarius: A Mission to Map Ocean Salinity
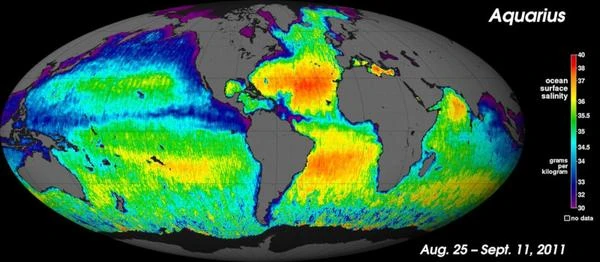
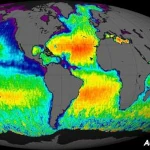
Comparison of Sea Surface Salinity (SSS).
Two global maps of sea surface salinity, measured in grams per kilogram (g/kg), illustrate temporal variations between 2011 and June 2015. The common color legend indicates that red and orange areas represent the highest salinities (up to 38 g/kg), while dark blue and violet areas represent the lowest salinities (up to 33 g/kg). Landmasses are shown in black, and missing data areas are indicated by a white square in the legend. These images allow visualization of permanent salinity structures, such as the Atlantic generally more saline than the Pacific, as well as seasonal and interannual changes, such as the evolution of large river plumes and the effects of climatic phenomena.
Image source: NASA/CONAE (new window).
Scientific summary
Astronoo's article presents the Aquarius mission, a space observatory dedicated to measuring sea surface salinity. Launched in 2011, it produced global maps with unprecedented precision of 0.2 PSU (Practical Salinity Unit, i.e. 0.2 grams of salt per kilogram of seawater) thanks to a passive radiometer operating in the L-band (frequency of about 1.4 GHz), whose sensitivity to variations in the emissivity of the sea surface makes it possible to deduce the salt content. This radiometer was associated with an active scatterometer to correct roughness effects due to wind and waves. The data revealed seasonal and interannual variability in salinity, influenced by hydrological cycles, ice melt and major rivers. Despite a breakdown in 2015, Aquarius validated ocean circulation models and laid the foundations for space hydro-climatology, serving as a reference for subsequent missions such as SMOS and SMAP.
What is the Aquarius mission and why is it essential for climate science ?
This article is dedicated to the Aquarius mission, a satellite developed by NASA and the Argentine space agency CONAE. But why is this mission essential for climate science? The answer lies in its unique ability to measure sea surface salinity from space. This parameter, long inaccessible on a large scale, is a key marker of the water cycle, ocean-atmosphere exchanges and thermohaline circulation. Before Aquarius, data came from buoys, ships or models, with limited spatial and temporal coverage. Thanks to its L-band radiometer, Aquarius was able to probe the emissivity of water, directly linked to its salt content, while correcting for the disturbing effects of wind and surface temperature. For four years, it provided monthly salinity maps, revealing fine structures such as the Amazon freshwater plumes or seasonal variations in the Gulf Stream. Its precision of 0.2 PSU made it possible to validate and refine climate models. Although the mission ended prematurely in 2015, its legacy is immense: it paved the way for a new discipline, space hydro-climatology, and its data remain a reference for current satellites such as SMOS and SMAP, thus contributing to a better understanding of the Earth's climate machine.
Also worth exploring
Continue your exploration of the Universe with these topics:
Why measure ocean salinity ?
A key indicator of the water cycle
Sea surface salinity plays a crucial role in global ocean dynamics. It influences water density, conditions thermohaline circulation and interacts with the water cycle and ocean-atmosphere heat exchanges. A salinity variation can reveal large-scale climatic processes, such as El Niño or seasonal shifts in the Gulf Stream. Yet, until 2011, measurements were essentially point-based or derived from modeling. The launch of the Aquarius satellite, designed by NASA and Argentina's CONAE, revolutionized this field by enabling direct, regular spatial observation of salinity on a global scale.
A high-precision microwave radiometry technology
The L-band radiometer and scatterometer
Aquarius was equipped with a passive radiometer operating at 1.413 GHz (L-band), sensitive to small variations in the emissivity of surface waters induced by their salt content. To correct for atmospheric disturbances and surface effects (wind, temperature, roughness), the satellite also carried an active L-band radar (scatterometer). The quasi-polar orbit at 657 km allowed global coverage in 7 days with a spatial resolution of about 150 km. The salinity measurements thus obtained had an accuracy of about 0.2 PSU (Practical Salinity Unit), sufficient to detect significant regional anomalies.
Scientific results and end of mission
A major contribution to understanding the ocean
During its 4 years of activity (from June 2011 to June 2015), Aquarius provided monthly global maps of surface salinity that made it possible to:
- Validate ocean circulation and evaporation-precipitation models.
- Track freshwater plumes from ice melt or major rivers (Amazon, Congo).
- Study seasonal and interannual variability of salinity, in connection with ENSO cycles.
In June 2015, an electrical failure ended the mission. However, the collected data remain a reference, particularly for ocean-atmosphere coupling and the calibration of successor satellites such as SMOS (ESA) and SMAP (NASA).
A legacy for space oceanography
Space hydro-climatology, a new discipline
Aquarius demonstrated that salinity could be reliably measured from space. Its success paved the way for a new discipline: space hydro-climatology. Aquarius data, freely accessible, continue to feed studies on global hydrological balances, ocean acidification and climate variability. By combining temperature, salinity and altimetry (for example with Jason-3), researchers now have coherent tools to understand energy flows in the global ocean.
Salinity, humidity, altimetry: the satellites complementary to Aquarius
| Satellite | Agency(ies) | Period | Main parameter | Technology used | Resolution / Precision |
|---|---|---|---|---|---|
| Aquarius | NASA / CONAE | 2011–2015 | Surface salinity | L-band radiometer + scatterometer | 150 km / ±0.2 PSU |
| SMOS | ESA / CNES | 2009–present | Salinity & soil moisture | L-band microwave interferometry | 50 km / ±0.2 PSU |
| SMAP | NASA | 2015–present | Soil moisture + salinity | Passive radiometer + radar (failed) | ~60 km / ±0.2 PSU |
| Jason-3 | CNES / NASA / EUMETSAT / NOAA | 2016–present | Sea surface height (altimetry) | Ku/C-band radar altimeter | ~10 cm altimetric precision |
References
FAQ: Everything you need to know about the Aquarius mission
What is the Aquarius mission?
Aquarius is an Earth observation satellite, developed by NASA and CONAE (the Argentine space agency), dedicated to measuring sea surface salinity. Launched in June 2011, it operated until June 2015. It was the first satellite specifically designed to map ocean salinity on a global scale, with an accuracy of 0.2 PSU (Practical Salinity Unit, i.e. 0.2 grams of salt per kilogram of seawater).
Why is ocean salinity an important parameter for climate?
Salinity is an essential tracer of the global hydrological cycle. It reflects freshwater exchanges between the ocean and the atmosphere (evaporation and precipitation), as well as continental freshwater inputs (ice melt, river runoff). By directly influencing the density of seawater, salinity is a fundamental driver of thermohaline circulation — the great ocean "conveyor belt" that distributes heat around the globe and regulates climate. A variation in salinity can thus reveal large-scale climate disruptions, such as El Niño episodes or changes in the Gulf Stream.
How did Aquarius measure salinity from space?
Aquarius used a passive radiometer operating in the L-band (frequency of about 1.4 GHz), a frequency range particularly sensitive to variations in the emissivity of the water surface. This emissivity decreases as the salt concentration increases. To obtain reliable measurements, Aquarius had to correct for atmospheric disturbances (water vapor, clouds) and surface roughness effects (wind, waves). This is why it also carried an active scatterometer (L-band radar) that measured surface roughness and made it possible to eliminate its influence on the radiometer data. This unique combination of radiometer and scatterometer enabled unprecedented precision.
What was the lifespan of Aquarius and why did it end?
The Aquarius mission lasted four years, from June 2011 to June 2015. The satellite provided data continuously during this period, making it possible to establish monthly maps of sea surface salinity. In June 2015, a major electrical failure affected the satellite's power system, making it impossible to continue scientific operations. Although the mission was cut short — it was initially planned to last at least three years with a possible extension — the quantity and quality of the data collected far exceeded the scientific objectives.
What are the main scientific results of Aquarius?
Aquarius delivered major results that have transformed our understanding of the ocean. It made it possible to validate and refine ocean circulation models and evaporation-precipitation models. The data revealed fine salinity structures previously inaccessible, such as freshwater plumes from major rivers (Amazon, Congo, Ganges) or from Arctic ice melt. Aquarius also highlighted seasonal and interannual variability in salinity, in connection with ENSO cycles (El Niño / La Niña) and shifts in ocean currents. These observations have helped to better understand ocean-atmosphere interactions and their role in climate regulation.
What is the legacy of the Aquarius mission for science?
Aquarius demonstrated irrefutably that ocean salinity could be measured reliably and regularly from space. Its success opened the way to a new scientific discipline, space hydro-climatology. Aquarius data, freely accessible, continue to feed studies on global hydrological balances, ocean acidification and climate variability. The mission also served as a reference for calibration of successor satellites such as SMOS (ESA) and SMAP (NASA). By combining salinity data (Aquarius, SMOS, SMAP) with temperature and altimetry data (Jason-3, Sentinel-6), researchers now have a coherent system for monitoring in real time the energy and hydrological flows of the global ocean.
What is the difference between Aquarius, SMOS and SMAP?
These three satellites measure salinity but with slightly different technologies and objectives. Aquarius (NASA/CONAE) combined a radiometer and a scatterometer in L-band, offering an accuracy of 0.2 PSU with a spatial resolution of 150 km. SMOS (ESA/CNES), launched in 2009 and still active, uses an L-band interferometric radiometer, with better spatial resolution (~50 km) but comparable accuracy. It also measures soil moisture. SMAP (NASA), launched in 2015, is primarily dedicated to soil moisture, but includes a capability for measuring ocean salinity with an L-band radiometer. Although its radar failed shortly after launch, it continues to provide useful salinity data, with a resolution of about 60 km. These three missions are complementary and their data are often used together.
Where can I access Aquarius data?
Aquarius data are freely accessible to the public. They are hosted by several data centers, including PO.DAAC (new window) (Physical Oceanography Distributed Active Archive Center) at NASA/JPL, as well as AVISO (new window) in France. The data are available in different formats and processing levels (levels 2 and 3), ranging from raw measurements to monthly global maps. Visualization and download tools are also offered to facilitate their use by the scientific community and the general public.
 How to Spot Starlink Satellite Trains in the Sky?
  AI, the Astronomer's New Eye: From Analysis to Cosmic Prediction
  What the First Images from Perseverance Show Us: The Surface of Mars, As If We Were There
  GRAIL Twin Probes: Mapping the Moon's Hidden Interior
  Earth Under Surveillance: Observation Satellites
  March 2010: The Ring of Fire Captured by the SDO Observatory
  Positions of Space Probes in 2025
  Giants of Observation: The Largest Ground-Based Telescopes
  Low Earth Orbits and their uses
  Pioneer, first message to extraterrestrials!
  Infrared images: how to make them visible?
  Sputnik 1 and 2: The Dawn of the Space Age
  ENVISAT: Ten Years of Uninterrupted Observation of Earth's Ecosystems
  Lagrange Points: Gravitational Gateways of the Solar System
  Mars Reconnaissance Orbiter: The Lynx Eye Revealing Martian Secrets
  Kepler: 4,000 Worlds and More, A New Map of the Sky
  Cheops Space Telescope: A New Vision on Exoplanets
  The world of Planck
  Rosetta Space Probe: Comet Churyumov-Gerasimenko
  The Hubble Space Telescope: Three Decades of Revelations
  Première photo du télescope Hubble
  Satellites that measure underwater relief
  MESSENGER: The First Probe to Visit the Mysterious Planet
  How GPS Locates Your Position at Any Time?
  The ISS and Beyond? Towards the End of a Space Chapter
  Space Telescopes: Humanity's Eye Beyond the Atmosphere
  Space Probes: Interplanetary Travelers and Beyond
  The GAIA satellite maps the Milky Way
  How to calculate the synchronous orbit?
  E-ELT: The World's Largest Optical Telescope
  Mercury probes
  Space debris: the nightmare of operational satellites
  Aquarius: A Mission to Map Ocean Salinity
  JWST: An Unprecedented Look at the First Lights of the Universe
  METEOSAT: A Key Satellite for Climate Monitoring
  Curiosity, the first shovel, sample of Martian soil
  From Mariner to Perseverance: Successes and Failures of Mars Probes
  Where is the geostationary orbit?
  MOM, the technological demonstration
  Venus under surveillance: an overview of space probes
  What Is an Astronomical Interferometer?
  The Philae Robot and the Rosetta Comet
  Mauna Kea Under the Stars: The CFHT Telescope in Pursuit of the Universe's Mysteries