


Slight Progress in the Global Ecological Footprint
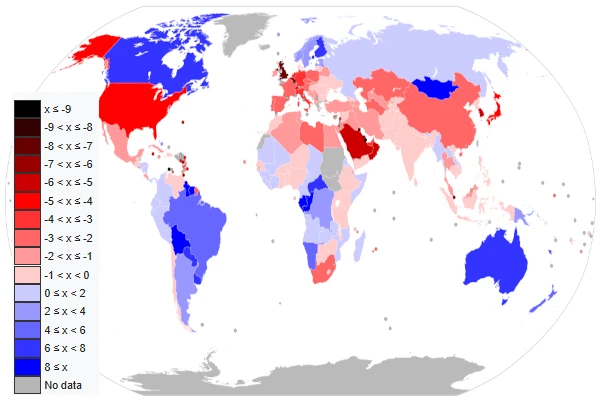
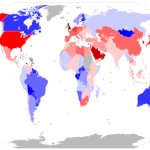
World map of the ecological footprint.
Biocapacity is the ability of a territory to produce renewable biological resources (food, fiber, wood, etc.) and to absorb waste (especially CO2), expressed in global hectares per capita (gha/cap).
Positive value (surplus): the country's biocapacity is greater than what its inhabitants consume.
Negative value (deficit): the ecological footprint exceeds biocapacity, the country consumes more than its nature can regenerate.
Image source: Creative Commons Attribution-Share Alike 4.0 International license. (new window)
Overconsumption and Planetary Pressure
Since the beginning of the industrial era, humanity has been exerting increasing pressure on natural resources. Energy consumption, mining, deforestation, and urbanization contribute to a rapid increase in the ecological footprint. If the world population continues to grow and average consumption per person increases, the demand for resources will far exceed the planet's regenerative capacity.
Ecological Surplus and Deficit by Country
The table highlights the extent of ecological imbalances at the national level. Countries with high per capita consumption and industrialization, such as the United States, Canada, or Germany, have the largest ecological deficits, with a footprint far exceeding national biocapacity. In contrast, several countries with per capita biocapacity greater than their consumption have an ecological surplus. This is the case for Australia or Venezuela. These surpluses reflect both low population densities and abundant natural resources. This distribution clearly shows that ecological deficit is correlated with per capita consumption and industrial intensity, while ecological surplus mainly depends on the availability of renewable resources and population density.
Table of ecological surpluses or deficits by country
| Country | Biocapacity (gha/cap) | Ecological Footprint (gha/cap) | Surplus / Deficit (gha/cap) | Comment |
|---|---|---|---|---|
| United States | 3.6 | 8.0 | -4.4 | Significant ecological deficit, consumption far exceeds national resources |
| Canada | 3.8 | 8.0 | -4.2 | High ecological deficit despite large biocapacity, due to very high per capita consumption |
| Germany | 1.6 | 5.0 | -3.4 | Significant ecological deficit, high per capita consumption and necessary imports |
| United Kingdom | 1.5 | 4.8 | -3.3 | High deficit, strong energy and industrial consumption |
| France | 3.1 | 5.0 | -1.9 | Ecological deficit, dependence on imports to meet consumption |
| China | 2.1 | 3.7 | -1.6 | Moderate to high deficit, pressure due to population and industrialization |
| India | 1.2 | 1.8 | -0.6 | Moderate deficit, insufficient resources for consumption |
| Colombia | 2.3 | 2.0 | +0.3 | Small ecological surplus, but positive |
| Russia | 5.5 | 5.0 | +0.5 | Slight surplus, large area and abundant resources offset per capita consumption |
| Chile | 2.5 | 2.0 | +0.5 | Slight surplus, moderate pressure on resources |
| Argentina | 3.8 | 3.0 | +0.8 | Moderate ecological surplus thanks to agricultural land and natural resources |
| Brazil | 4.5 | 2.8 | +1.7 | Ecological surplus, resources exceed consumption |
| Venezuela | 8.0 | 5.5 | +2.5 | High ecological surplus due to high per capita biocapacity |
| Australia | 9.0 | 6.5 | +2.5 | High ecological surplus due to low population density and significant biocapacity |
Global Evolution of the Ecological Footprint
The human ecological footprint continues to grow slightly, exceeding Earth's regenerative capacity. Some positive effects of human corrective actions are beginning to be perceived, but they remain very modest on a global scale. The transition to renewable energies, the reduction of excessive consumption, and the protection of ecosystems are essential to avoid global ecological collapse.
Table of the evolution of global ecological footprint and biocapacity
| Year | Average global biocapacity (gha/cap) | Average global ecological footprint (gha/cap) | Deficit / Surplus (gha/cap) | Comment |
|---|---|---|---|---|
| 2000 | 1.8 | 2.3 | -0.5 | Moderate global deficit, consumption slightly higher than biocapacity |
| 2005 | 1.8 | 2.5 | -0.7 | Increasing ecological deficit with global economic growth |
| 2010 | 1.8 | 2.6 | -0.8 | Increased pressure on renewable resources, continuing overshoot trend |
| 2015 | 1.7 | 2.7 | -1.0 | The global deficit is increasing, consumption significantly exceeds biocapacity |
| 2020 | 1.7 | 2.8 | -1.1 | Significant global ecological deficit, need for measures to reduce the footprint |
| 2024 | 1.7 | 2.8 | -1.1 | Similar situation to 2020, human consumption continues to exceed available resources |
 The Paleocene-Eocene Transition: When Earth's Climate Suddenly Changed
  The Principle of Least Action: Why Does Nature Always Choose the Most Economical Path?
  Evolutionary Convergence: Chance, Necessity… or Mirage?
  The Five Mass Extinctions: What do these planetary catastrophes reveal?
  Cryosphere: when the ice giants still protect us
 The Nitrogen Cycle: From Air to Life
 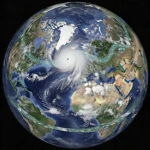 The Jet Stream: When the Atmospheric River Overflows Its Banks
 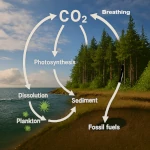 The Carbon Cycle: The Harmonious Interaction of Oceans, Forests, and Subsoils
  The Water Paradox: Without it, no life
 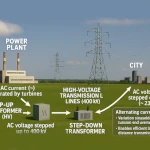 Why did alternating current prevail?
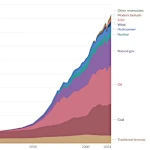 Evolution of Global Energy Consumption: From Steam Engines to Digital Servers
 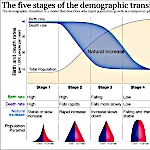 The Demographic Transition: Growth or Decline?
 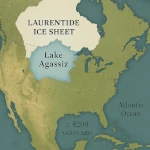 Lake Agassiz: A Deluge that Changed the Climate
 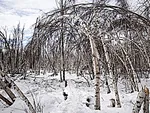 Drunken Forests: Understanding the Phenomenon of Permafrost Thaw
  There is Electricity in the Air!
 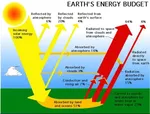 Why Doesn't CO2 Fall to the Ground?
 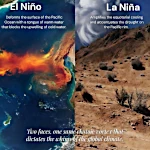 El Niño and La Niña: the two climatic phenomena of the Pacific
  Endangered Species: Dynamics of Extinction
  The Toxic Legacy of Acid Rain
  Major societal collapses: key periods and causes
 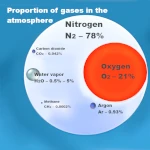 Global Warming in Figures: What the Scientific Data Says
  What is Sustainable Development?
 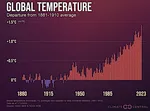 The Hottest Years Since Records Began
  Magnitude of upcoming climate change
  Earth in Crisis: Collapse or Renaissance?
  Ice on Borrowed Time: The Inexorable Decline of Arctic Sea Ice
 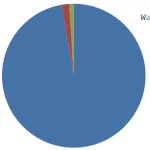 Earth's Water Reservoirs: From Oceans to Groundwater
  Sea Levels Are Rising, But How Fast?
  The Other Climate Threat: Earth Shrouded in Shadow and Humidity
  The Age of the Sahara: From Green Prairie to Stone Desert
  World Population from 1800 to 2100
  Oil: The Fall of a Giant in the Era of Renewable Energy
  Kamchatka King Crab: A Giant of the Oceans
  The collapse of a society
  Slight Progress in the Global Ecological Footprint
  The South Atlantic Anomaly
  The phenomenon of soil sinking is called subsidence
  The Planet's New Clouds