
Global warming is causing an accelerated decline in polar sea ice. The average rise in global temperatures is altering the thermal balance of the oceans and increasing seasonal melting. The reduction in ice cover directly impacts Earth's albedo \(\alpha\), creating a feedback effect on warming. The poles thus become crucial indicators of climate change.
The decline in sea ice is causing major disruptions for ice-dependent species such as polar bears, seals, and penguins. Habitat fragmentation reduces access to food and directly affects survival and reproduction rates.
The loss of ice leads to increased absorption of solar radiation by the ocean due to the reduction in albedo \(\alpha\). This additional heat causes the surface layers to thaw, alters water density, and can accelerate surface currents, disrupting benthic and pelagic ecosystems. Variations in salinity and temperature influence the reproduction and migration of marine species.
The opening of new Arctic maritime routes facilitates traffic but increases the risk of pollution and the introduction of invasive species. Extreme seasonal variations and intense weather events are becoming more frequent, amplifying ecological stress. The rapid melting of continental glaciers contributes to sea level rise, affecting coastal habitats and global marine systems.
Thus, the reduction of sea ice is a global indicator of climate change, with extensive physical and biological consequences. It influences Earth's albedo, the redistribution of energy flows, and marine biodiversity on a planetary scale.
The curve is linearized because annual figures are rounded to 2 decimal places and smoothed for the overall trend. In reality, Arctic sea ice does not decrease in a perfectly linear manner: it shows strong interannual variations due to several physical factors (climate cycles, storms, winds and ocean currents, albedo, etc.).
| Year | Minimum extent (million km²) | Maximum extent (million km²) | Comment |
|---|---|---|---|
| 1979 | 7.01 | 15.68 | Start of satellite observations |
| 1980 | 6.95 | 15.62 | Similar value to 1979 |
| 1981 | 6.88 | 15.55 | Slight decrease |
| 1982 | 6.80 | 15.48 | Natural fluctuations |
| 1983 | 6.72 | 15.41 | Downward trend |
| 1984 | 6.65 | 15.34 | Natural fluctuations |
| 1985 | 6.58 | 15.27 | Slight decrease |
| 1986 | 6.51 | 15.20 | Natural fluctuations |
| 1987 | 6.44 | 15.13 | Slight decrease |
| 1988 | 6.37 | 15.06 | Natural fluctuations |
| 1989 | 6.30 | 14.99 | Slight decrease |
| 1990 | 6.23 | 14.92 | Natural fluctuations |
| 1991 | 6.16 | 14.85 | Slight decrease |
| 1992 | 6.09 | 14.78 | Natural fluctuations |
| 1993 | 6.02 | 14.71 | Slight decrease |
| 1994 | 5.95 | 14.64 | Natural fluctuations |
| 1995 | 5.88 | 14.57 | Slight decrease |
| 1996 | 5.81 | 14.50 | Natural fluctuations |
| 1997 | 5.74 | 14.43 | Slight decrease |
| 1998 | 5.67 | 14.36 | Natural fluctuations |
| 1999 | 5.60 | 14.29 | Slight decrease |
| 2000 | 5.53 | 14.22 | Natural fluctuations |
| 2001 | 5.46 | 14.15 | Slight decrease |
| 2002 | 5.39 | 14.08 | Natural fluctuations |
| 2003 | 5.32 | 14.01 | Slight decrease |
| 2004 | 5.25 | 13.94 | Natural fluctuations |
| 2005 | 5.18 | 13.87 | Slight decrease |
| 2006 | 5.11 | 13.80 | Natural fluctuations |
| 2007 | 5.04 | 13.73 | Second lowest minimum extent recorded |
| 2008 | 4.97 | 13.66 | Partial recovery |
| 2009 | 4.90 | 13.59 | Third lowest minimum extent |
| 2010 | 4.83 | 13.52 | Partial recovery |
| 2011 | 4.76 | 13.45 | Fourth lowest minimum extent |
| 2012 | 4.69 | 13.38 | Absolute historical minimum |
| 2013 | 4.62 | 13.31 | Partial recovery |
| 2014 | 4.55 | 13.24 | Partial recovery |
| 2015 | 4.48 | 13.17 | Sixth lowest minimum extent |
| 2016 | 4.41 | 13.10 | Second lowest minimum extent |
| 2017 | 4.34 | 13.03 | Seventh lowest minimum extent |
| 2018 | 4.27 | 12.96 | Eighth lowest minimum extent |
| 2019 | 4.20 | 12.89 | Third lowest minimum extent |
| 2020 | 4.13 | 12.82 | Fifth lowest minimum extent |
| 2021 | 4.06 | 12.75 | Partial recovery |
| 2022 | 3.99 | 12.68 | Seventh lowest minimum extent |
| 2023 | 3.92 | 12.61 | Sixth lowest minimum extent |
| 2024 | 3.85 | 12.54 | Seventh lowest minimum extent |
Source: NSIDC – Arctic Sea Ice News and NASA Climate Vital Signs.
 The Principle of Least Action: Why Does Nature Always Choose the Most Economical Path?
  Evolutionary Convergence: Chance, Necessity… or Mirage?
 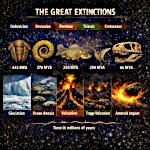 The Five Mass Extinctions: What do these planetary catastrophes reveal?
 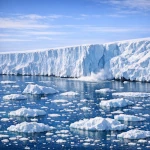 Cryosphere: when the ice giants still protect us
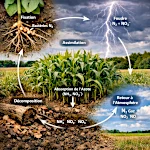 The Nitrogen Cycle: From Air to Life
 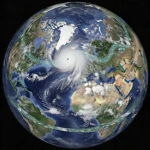 The Jet Stream: When the Atmospheric River Overflows Its Banks
 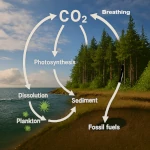 The Carbon Cycle: The Harmonious Interaction of Oceans, Forests, and Subsoils
  The Water Paradox: Without it, no life
 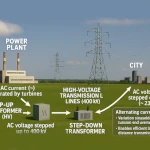 Why 220V Alternating Current is in Our Outlets: A Matter of Physics
  The Last Glacial Shock: The Younger Dryas and Its Impact on Prehistoric Societies
 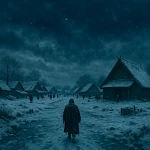 536: The Year Without a Summer and the Beginning of the Late Antique Little Ice Age
  The Minimal Cell: The Inevitable Emergence
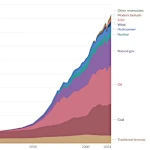 Evolution of Global Energy Consumption: From Steam Engines to Digital Servers
 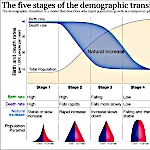 The Demographic Transition: Growth or Decline?
 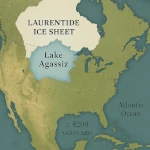 Lake Agassiz: A Deluge that Changed the Climate
 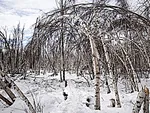 Drunken Forests: Understanding the Phenomenon of Permafrost Thaw
 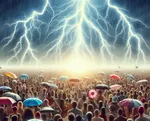 There is Electricity in the Air!
 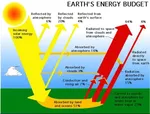 Why Doesn't CO2 Fall to the Ground?
 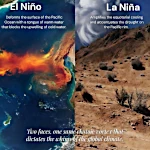 El Niño and La Niña: The Two Breaths of the Pacific That Shape Global Climate
  Endangered Species: Dynamics of Extinction
  The Toxic Legacy of Acid Rain
  Global Warming in Figures: What the Scientific Data Says
 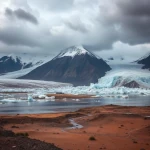 What is Sustainable Development?
  The Aral Sea: A Lesson for Humanity
  Three Gorges Dam: Impacts on Ecosystems
 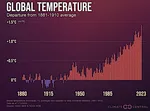 The Hottest Years Since Records Began
 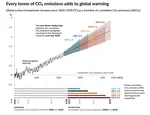 Magnitude of future global warming
  Earth in Crisis: Collapse or Renaissance?
  Ice on the Brink: The Inevitable Decline of Arctic Sea Ice
  Earth's Water Reservoirs: From Oceans to Groundwater
  Sea Levels Are Rising, But How Fast?
  The Other Climate Threat: Earth Shrouded in Shadow and Humidity
 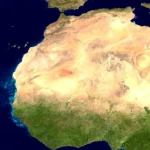 The Age of the Sahara: From Green Prairie to Stone Desert
 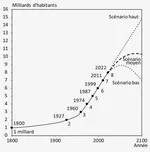 World Population from 1800 to 2100
 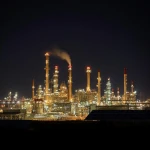 Oil: The Fall of a Giant in the Era of Renewable Energy
 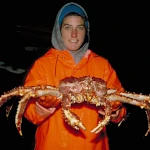 Kamchatka King Crab: A Giant of the Oceans
  The collapse of a society
  Slight Progress in the Global Ecological Footprint
 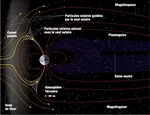 The South Atlantic Anomaly
  The phenomenon of soil sinking is called subsidence
  Why Is Earth So Often Cloudy?
  The Planet's New Clouds
 Desertec: A Solar Dream for Europe and Africa