The work of Svante Arrhenius (1859-1927) had already established the link between CO₂ and temperature as early as 1896. Today, attribution studies show that human activities are responsible for more than 95% of the warming observed since 1950.
The concentration of carbon dioxide in the atmosphere has experienced an unprecedented increase since the beginning of the industrial era, rising from 280 ppm (parts per million) in the mid-19th century to 420 ppm today.
Global warming represents one of the major challenges of the 21st century. Behind media and political discourses lie complex scientific data that deserve to be deciphered.
Data from NASA and the NOAA show an average increase of 1.2°C since the pre-industrial era (1850-1900). This value may seem modest, but it hides significant regional variations: the Arctic is warming 2 to 3 times faster than the global average.
N.B.:
1850–1900 is the period when reliable instrumental measurements began to be available globally, before industrial emissions became massive. Estimated average temperature: About 13.7°C in 1900 (vs ~14.9°C in 2023–2025, i.e., a +1.2°C increase).
Human activities responsible for this increase can be classified in order of importance:
| Source | Annual Contribution | Evolution since 1990 | Current Trends |
|---|---|---|---|
| Fossil fuel combustion | ~36 billion tonnes | +60% | Stagnation in some developed countries |
| Deforestation and land use change | ~5-10 billion tonnes | Stable to slight increase | Concerning in Amazonia and Southeast Asia |
| Cement production | ~2.5 billion tonnes | +200% | Strong growth with urbanization |
| Intensive agriculture | ~1-2 billion tonnes | +30% | Possible stabilization with new practices |
This value represents the increase in the average temperature at the Earth's surface but this global average hides complex realities. It is not a uniform increase that would be felt everywhere on the planet. This value of 1.2°C is a global average calculated over the entire globe:
| Region | Observed Warming | Amplification Factor | Explanations |
|---|---|---|---|
| Arctic | +3 to +4°C | × 3 | Polar amplification due to ice melt |
| Continents | +1.5 to +2°C | × 1.5 | Land warms faster than oceans |
| Oceans | +0.8 to +1°C | × 0.8 | High heat capacity of water |
| Tropical regions | +0.8 to +1.2°C | × 1 | Warming close to the global average |
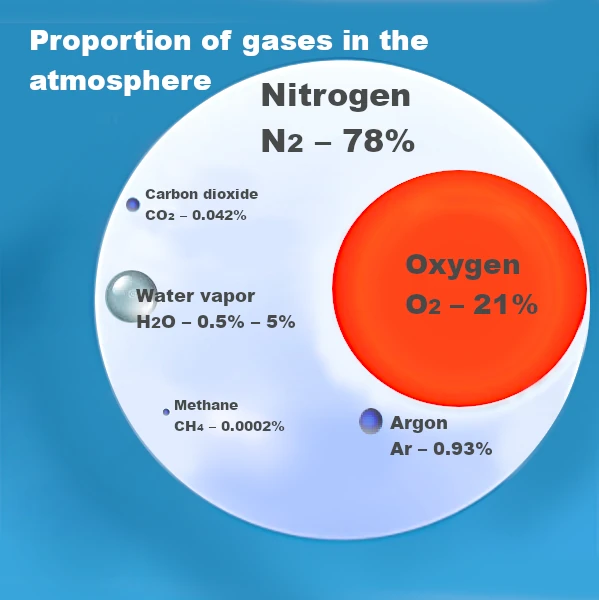
How can a gas, CO₂, present in such a small proportion (0.04% of the atmosphere) have such a determining influence on the Earth's climate? The answer lies in the specific physical properties of carbon dioxide and its role in the greenhouse effect.
Carbon dioxide (CO₂) has a linear and asymmetric structure (O=C=O) that gives it unique infrared absorption properties. Unlike oxygen (O₂) or nitrogen (N₂), CO₂ can vibrate in a way that efficiently absorbs the thermal radiation emitted by the Earth, and then re-emit it in all directions – including back towards the Earth's surface.
The CO₂ molecule mainly absorbs infrared in the 15 µm (micrometer) band, a wavelength characteristic of Earth's thermal radiation. This absorption results from its three vibration modes:
These vibrations change the molecule's dipole moment, a necessary condition to interact with infrared electromagnetic waves. CO₂ absorbs IR photons whose energy corresponds to its vibrational transitions (like asymmetric stretching), then re-emits this energy as heat or new photons, thus contributing to the greenhouse effect.
Ground state (CO₂) ─────[Absorption of an IR photon]─────► Excited vibrational state (E = hν, λ ≈ 15 µm) Excited state ─────[Re-emission of an IR photon or collision]─────► Ground state + heat
By re-emitting part of the infrared radiation towards the surface, CO₂ contributes to trapping part of the heat in the atmosphere. Unlike water vapor (another major greenhouse gas), its concentration is less sensitive to local temperature variations, making it a long-term climate regulator.
Oxygen (O₂) and nitrogen (N₂), which are majority in the atmosphere (99%), do not absorb infrared because their bonds are symmetric and non-polar. In contrast, methane (CH₄) or nitrous oxide (N₂O) have structures even more effective than CO₂ at absorbing IR, but their concentration is much lower. CO₂ therefore plays a central role in the Earth's radiative balance.
N.B.:
Normally, CO₂ is electrically neutral. But when it vibrates, it develops a small unbalanced charge. This property allows it to intercept infrared – the heat that the Earth tries to evacuate into space. Without this mechanism, the average temperature on Earth would be 30°C colder!
The IPCC has developed several scenarios, from the most optimistic (SSP1-1.9) to the most pessimistic (SSP5-8.5). These projections take into account greenhouse gas emissions, global demographics and climate policies.
| Scenario | Description | Warming in 2100 | Major Consequences |
|---|---|---|---|
| SSP1-1.9 | Ambitious climate actions Carbon neutrality around 2050 | 1.4°C to 1.8°C | Limited impacts, adaptation possible |
| SSP1-2.6 | Moderate sustainable development Net zero emissions after 2050 | 1.7°C to 2.8°C | Moderate risks, ecosystems under pressure |
| SSP2-4.5 | Continuation of current trends Stabilization of emissions around 2050 | 2.1°C to 3.5°C | Moderate to high risks |
| SSP3-7.0 | Uneven development and competition Continuous emissions until 2100 | 2.8°C to 4.6°C | High to very high risks |
| SSP4-6.0 | Pronounced inequalities High-emission technologies | 2.5°C to 4.2°C | High risks, uneven adaptation |
| SSP5-8.5 | Strong development of fossil fuels Intensive economic growth | 3.3°C to 5.7°C | Catastrophic consequences |
Source: IPCC, AR6 Report, 2021; CMIP6 Scenario Database; NASA Climate Change.
The Earth is a thermodynamic system constantly seeking stability. The climate functions in the same way: certain key elements of our planet could, beyond a certain threshold, change radically and irreversibly. These critical thresholds are called tipping points. A tipping point is a threshold beyond which a climate system:
N.B.:
These phenomena are not distant predictions: some could be triggered with a warming of 1.5 to 2°C. Once crossed, their effects could propagate like dominoes through the climate system.
Experts from the IPCC, NASA, and recent studies published in Nature and Science (2020-2024) identify several vulnerable climate systems. These tipping points could be triggered with a warming of 1.5°C to 2°C, a threshold we are rapidly approaching (1.2°C reached in 2025). Their crossing would lead to changes irreversible on a human timescale and cascade effects on the entire Earth system.
| Climate System | Triggering Threshold | Major Consequences | Current Status (2025) |
|---|---|---|---|
| Melting of the Greenland ice sheet | 1.1°C - 1.5°C | Sea level rise of 7 meters (over several centuries), disruption of ocean currents | Accelerated mass loss: 5,000 Gt/year of melted ice |
| Weakening of the AMOC (Atlantic current) | 1.4°C - 2°C | Winters 5 to 10°C colder in Europe, disruption of monsoons, sea level rise on the US East Coast | Slowing of 15% since 1950 |
| Disappearance of summer Arctic sea ice | 1.5°C - 2°C | Acceleration of warming (reduction of albedo), disruption of polar ecosystems, methane release | 40% reduction in area since 1979 |
| Thawing of permafrost | 1.5°C - 2°C | Release of 200 to 400 Gt of carbon (CO₂ and CH₄) by 2100, amplifying warming | Already observed in Siberia and Alaska with increasing methane emissions |
| Transformation of the Amazon rainforest into savanna | 2°C (locally +4°C) | Release of 200 Gt of CO₂, loss of biodiversity, disruption of the water cycle | 17% deforested (critical threshold estimated at 20-25%) |
| Collapse of the West Antarctic Ice Sheet | 1.5°C - 2°C | Sea level rise of 3 to 5 meters (over several centuries) | Accelerated melting, notably of the Thwaites Glacier ("Doomsday Glacier") |
N.B.:
A study published in Science (2022) estimates that we have already crossed 5 of the 16 identified tipping points, including partial melting of Greenland and West Antarctica, and the slowing of the AMOC.
Every tenth of a degree counts: limiting warming to 1.5°C rather than 2°C could avoid crossing several tipping points.
 The Principle of Least Action: Why Does Nature Always Choose the Most Economical Path?
  Evolutionary Convergence: Chance, Necessity… or Mirage?
  The Five Mass Extinctions: What do these planetary catastrophes reveal?
  Cryosphere: when the ice giants still protect us
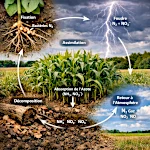 The Nitrogen Cycle: From Air to Life
  The Jet Stream: When the Atmospheric River Overflows Its Banks
 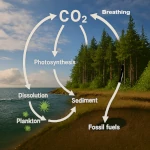 The Carbon Cycle: The Harmonious Interaction of Oceans, Forests, and Subsoils
 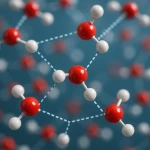 The Water Paradox: Without it, no life
  Why 220V Alternating Current is in Our Outlets: A Matter of Physics
  The Last Glacial Shock: The Younger Dryas and Its Impact on Prehistoric Societies
  536: The Year Without a Summer and the Beginning of the Late Antique Little Ice Age
  The Minimal Cell: The Inevitable Emergence
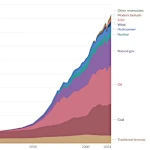 Evolution of Global Energy Consumption: From Steam Engines to Digital Servers
 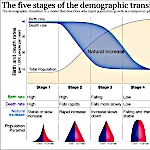 The Demographic Transition: Growth or Decline?
 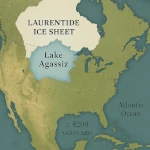 Lake Agassiz: A Deluge that Changed the Climate
 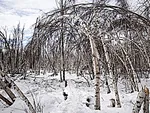 Drunken Forests: Understanding the Phenomenon of Permafrost Thaw
  There is Electricity in the Air!
  Why Doesn't CO2 Fall to the Ground?
  El Niño and La Niña: The Two Breaths of the Pacific That Shape Global Climate
  Endangered Species: Dynamics of Extinction
  The Toxic Legacy of Acid Rain
 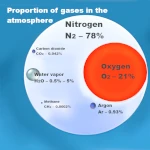 Global Warming in Figures: What the Scientific Data Says
 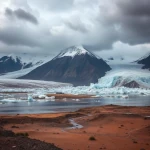 What is Sustainable Development?
 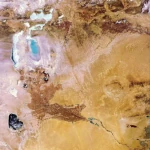 The Aral Sea: A Lesson for Humanity
 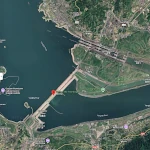 Three Gorges Dam: Impacts on Ecosystems
 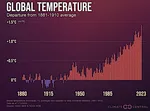 The Hottest Years Since Records Began
 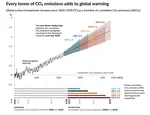 Magnitude of future global warming
  Earth in Crisis: Collapse or Renaissance?
  Ice on the Brink: The Inevitable Decline of Arctic Sea Ice
  Earth's Water Reservoirs: From Oceans to Groundwater
  Sea Levels Are Rising, But How Fast?
  The Other Climate Threat: Earth Shrouded in Shadow and Humidity
 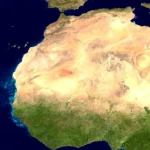 The Age of the Sahara: From Green Prairie to Stone Desert
 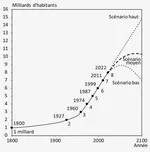 World Population from 1800 to 2100
 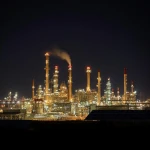 Oil: The Fall of a Giant in the Era of Renewable Energy
  Kamchatka King Crab: A Giant of the Oceans
  The collapse of a society
  Slight Progress in the Global Ecological Footprint
  The South Atlantic Anomaly
  The phenomenon of soil sinking is called subsidence
  Why Is Earth So Often Cloudy?
  The Planet's New Clouds
 Desertec: A Solar Dream for Europe and Africa