Rising sea levels are one of the most tangible consequences of global warming. Since the beginning of the 20th century, the global mean sea level has risen measurably, and this rise has accelerated over the past few decades. What do recent scientific data tell us about the crucial question: how fast are sea levels rising?
Tide gauges, instruments that measure sea level from the coast, provide data dating back to the 18th century in some regions. Analysis of these records reveals that the global mean sea level rose by about 1.5 mm per year between 1900 and 2000. However, this average rate hides a significant acceleration over the century.
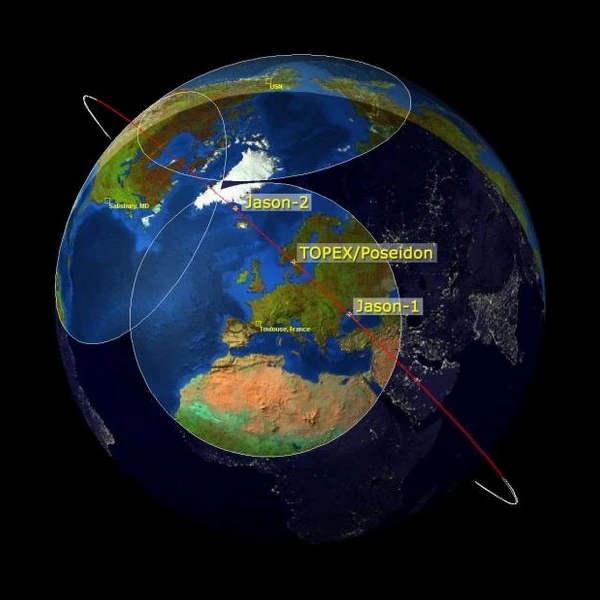
Since 1993, altimetry satellites (TOPEX/Poseidon, Jason-1, Jason-2, Jason-3, and Sentinel-6) have enabled precise and global measurements. These data show an average rise of 3.4 mm per year over the period 1993-2023, more than double the average rate of the previous century.
The rise in sea levels is mainly due to two physical phenomena linked to global warming:
IPCC (Intergovernmental Panel on Climate Change) projections indicate that future rises will depend closely on our greenhouse gas emissions. According to scenarios:
Beyond 2100, the rise will continue for several centuries, even if emissions are stabilized, due to the inertia of the climate system.
It is important to note that the rise is not uniform across the globe. Some regions experience a rise above the global average, while others record a lower rise, or even a relative drop. These variations are explained by:
| Period | Rise rate (mm/year) | Cumulative rise (cm) | Uncertainty | Main method | Scenario |
|---|---|---|---|---|---|
| 1901-1990 | 1.5 | ~13.5 | ± 0.2 | Tide gauges | Observed data |
| 1993-2023 | 3.4 | ~10.2 | ± 0.4 | Satellite altimetry | Observed data |
| 2006-2018 | 3.7 | ~4.8 | ± 0.5 | Altimetry + tide gauges + Argo floats | Observed data |
| Projection 2030 | 4.5-5.5 | +4-6 (vs 2020) | Average | Climate models | RCP4.5 |
| Projection 2050 | 5.0-8.0 | +15-25 (vs 2020) | Moderate to high | Climate models | RCP4.5 - RCP8.5 |
| Projection 2080 | 6.0-12.0 | +35-60 (vs 2020) | High | Climate models | RCP4.5 - RCP8.5 |
| Projection 2100 (RCP8.5 scenario) | 8-16 | +60-110 (vs 2020) | Very high | Climate models | RCP8.5 |
Source: IPCC, 6th Assessment Report (2023), NASA Sea Level Change and Nature Climate Change (2021).
Scientific data converge to confirm that sea levels are rising at an accelerating rate, directly linked to human activities and global warming. The current rate of about 3.4 mm per year could increase significantly during the 21st century, with major consequences for coastal populations and ecosystems.
 The Principle of Least Action: Why Does Nature Always Choose the Most Economical Path?
  Evolutionary Convergence: Chance, Necessity… or Mirage?
  The Five Mass Extinctions: What do these planetary catastrophes reveal?
  Cryosphere: when the ice giants still protect us
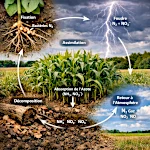 The Nitrogen Cycle: From Air to Life
  The Jet Stream: When the Atmospheric River Overflows Its Banks
 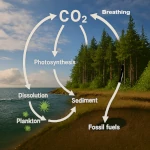 The Carbon Cycle: The Harmonious Interaction of Oceans, Forests, and Subsoils
  The Water Paradox: Without it, no life
 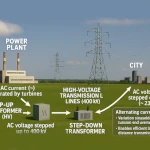 Why 220V Alternating Current is in Our Outlets: A Matter of Physics
  The Last Glacial Shock: The Younger Dryas and Its Impact on Prehistoric Societies
  536: The Year Without a Summer and the Beginning of the Late Antique Little Ice Age
  The Minimal Cell: The Inevitable Emergence
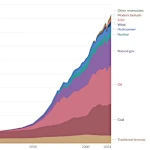 Evolution of Global Energy Consumption: From Steam Engines to Digital Servers
 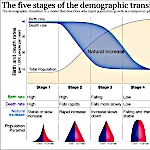 The Demographic Transition: Growth or Decline?
 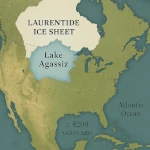 Lake Agassiz: A Deluge that Changed the Climate
 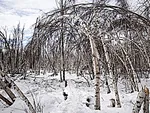 Drunken Forests: Understanding the Phenomenon of Permafrost Thaw
  There is Electricity in the Air!
  Why Doesn't CO2 Fall to the Ground?
 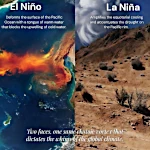 El Niño and La Niña: The Two Breaths of the Pacific That Shape Global Climate
  Endangered Species: Dynamics of Extinction
  The Toxic Legacy of Acid Rain
  Global Warming in Figures: What the Scientific Data Says
  What is Sustainable Development?
  The Aral Sea: A Lesson for Humanity
 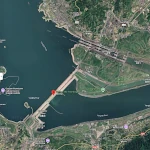 Three Gorges Dam: Impacts on Ecosystems
 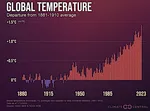 The Hottest Years Since Records Began
 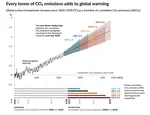 Magnitude of future global warming
 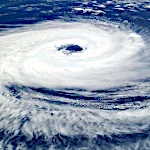 Earth in Crisis: Collapse or Renaissance?
 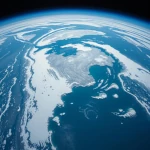 Ice on the Brink: The Inevitable Decline of Arctic Sea Ice
  Earth's Water Reservoirs: From Oceans to Groundwater
  Sea Levels Are Rising, But How Fast?
  The Other Climate Threat: Earth Shrouded in Shadow and Humidity
  The Age of the Sahara: From Green Prairie to Stone Desert
 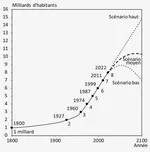 World Population from 1800 to 2100
 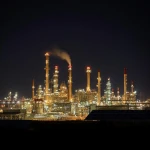 Oil: The Fall of a Giant in the Era of Renewable Energy
  Kamchatka King Crab: A Giant of the Oceans
  The collapse of a society
  Slight Progress in the Global Ecological Footprint
 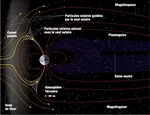 The South Atlantic Anomaly
  The phenomenon of soil sinking is called subsidence
 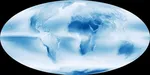 Why Is Earth So Often Cloudy?
  The Planet's New Clouds
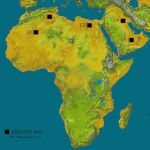 Desertec: A Solar Dream for Europe and Africa