Warmest years since 1880
Our planet is alive
The Earth is a living planet, now this "macro body" is feverish and humanity that dwells in panic every flood, storm, tsunami and another earthquake.
And yet we continue, year after year, to help increase the temperature inside the greenhouse that protects us for millions of years.
The 9 warmest years since 1880, are between 2000 and 2012, according to NASA scientists.
The medium-term forecasts are alarmist, a warming of 1.4 to 5.8 degrees Celsius is foreseen by the end of the 21st century. This will be the largest increase in Earth's temperature since 10,000 years.
Between the ice age, 20,000 years ago and the hottest period, there are 7000 years, there were only 7 ° C difference. If the temperature of the Earth increases by a century of 5.8 degrees Celsius as advertised, the living world will have to adapt very quickly. The first consequences of global warming are already visible. Indeed we see every day as glaciers retreat, floods are more devastating, that periods of drought return more frequently, the Arctic sea ice decreases... However, the scale of humanity is so small compared to the geologically it is pretentious to believe that warming of this magnitude has never happened in the past. There are certainly many factors that can influence the Earth's climate and we are far from knowing all. However, many analyzes show that our involvement in global warming temperatures on the surface of the Earth. We are aware of this and it is likely, despite "all our efforts," we will not be able to change the temperature curve started. The global ecological footprint, created in the 1990s by MM. Mathis Wackernagel and William Rees, two researchers from the University of British Columbia in Vancouver, is the pressure exerted by humanity over nature.
It assesses the productive area required for a population to meet its consumption of resources and needs to absorb waste.
Since 2007 this demand exceeds the capacity limits of ecosystem restoration.
The human economy is in ecological overshoot.
The overall ecological footprint of humanity has increased by 50% between 1970 and 1997, an increase of approximately 1.5% per year.
The increasing proliferation of the human species on the planet can cause a real environmental collapse as humanity uses water faster than it is recharged into the ground. it cut forests faster than they can regenerate, emits CO2 into the atmosphere faster than it can absorb.
Human societies are still animal societies, they exploit until exhaustion total resources available to them. Sooner or later, we must reorganize and adapt as we needed every time the "Nature".
Image: These color maps show global temperature anomalies at the surface from 1980 to 1984 and from 2008 to 2012. The temperature rises the highest compared to the normal (average 1951-1980), in blue, negative anomalies (up to -2 ° C) and the red positive (up to 2 ° C). Credit: NASA / Goddard Space Flight Center Scientific Visualization Studio NASA Goddard Institute for Space Studies.
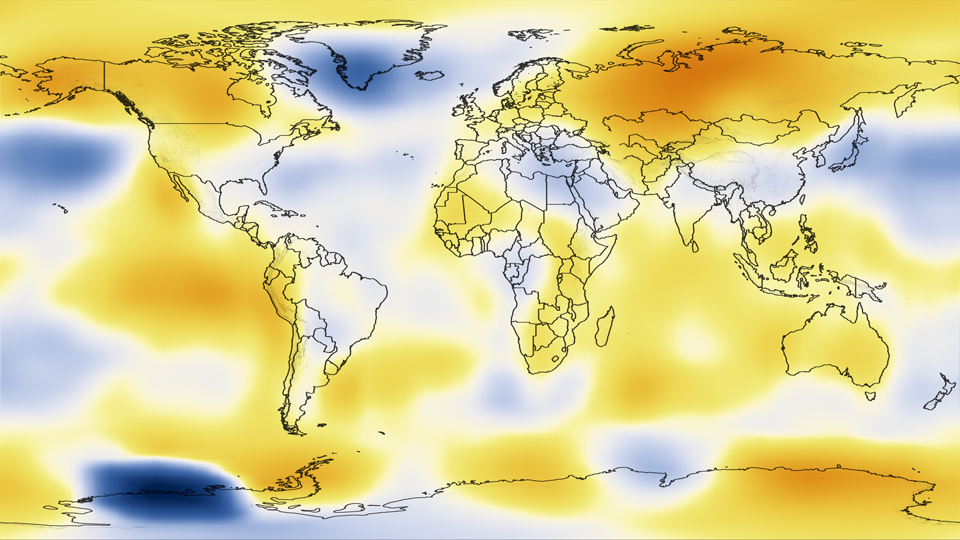
Image: This world map shows temperature anomalies from 1980 to 1984.
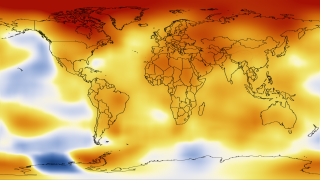
Image: This world map shows temperature anomalies from 2008 to 2012..
The 10 warmest years
The temperature at the surface of the globe in 2012 was higher by 0.55 ° C (1 ° F), compared to the average temperatures from 1951 to 1980 (source data from the Goddard Institute for Space Studies published in January 2013). The temperature of the planet varies from year to year, so quickly that it is possible to represent a color map, this increase as a sensitive indicator of the frequency of climate anomalies. Global average temperature over 5 years, has stagnated since ten years, which we interpret as a combination of natural variables and a slowdown in the growth rate of climate forcing. The analysis reveals that in 2012 NASA had almost the same global temperature in 2011, well below the peak reached in 2010. These short-term global fluctuations are mainly associated with natural oscillations of surface temperatures of the tropical Pacific sea. But 2012 is nominally the ninth warmest year since 1880. We reject more CO2 and other waste and that odorous likely to continue because the energy needs of the world population increases, with demographics. We note at once that nature unleashes more violently and at the same time that the living world is struggling to adapt to these climatic fluctuations, leaving the weakest. Everything happens as if our "macro body" Earth is currently undergoing a small "fever".
Just as in warm-blooded animals, fever is a reaction of defense against internal aggression which requires him to activate certain immune mechanisms to regain his balance.
Let's just hope that these mechanisms are not fighting man as if it were an infectious agent abroad. Humanity now advised has to prove it is a constituent own and not alien from the planet Earth.
NB: The 10 warmest years have all been recorded since 1998.
The warming trend in the long term, including warming steadily since the 1970s, has been definitively associated with greenhouse gas anthropogenic become important in the early 20th century.
 The Demographic Transition: Growth or Decline?
  Lake Agassiz: A Deluge that Changed the Climate
 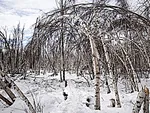 Drunken Forests: Understanding the Phenomenon of Permafrost Thaw
  There is Electricity in the Air!
 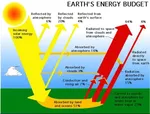 Why Doesn't CO2 Fall to the Ground?
 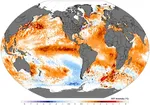 Dramatic Consequences of the El Niño Phenomenon
  Endangered Species: Dynamics of Extinction
  The Toxic Legacy of Acid Rain
 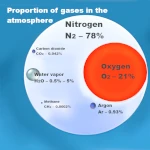 Global Warming in Figures: What the Scientific Data Says
  What is Sustainable Development?
  The Aral Sea: A Lesson for Humanity
 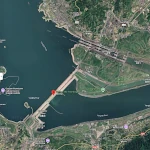 Three Gorges Dam: Impacts on Ecosystems
 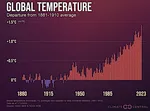 The Hottest Years Since Records Began
 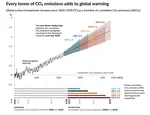 Magnitude of future global warming
  Earth in Crisis: Collapse or Renaissance?
  Ice on the Brink: The Inevitable Decline of Arctic Sea Ice
  Earth's Water Reservoirs: From Oceans to Groundwater
 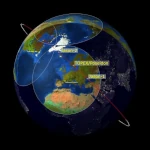 Sea Levels Are Rising, But How Fast?
  Global Dimming: A Dangerous Respite in the Climate Crisis
 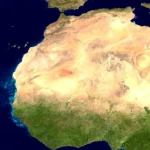 The Age of the Sahara: From Green Prairie to Stone Desert
 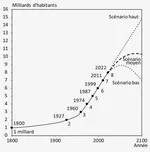 World Population from 1800 to 2100
 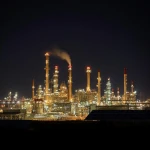 Oil: The Fall of a Giant in the Era of Renewable Energy
  Kamchatka King Crab: A Giant of the Oceans
  The
collapse of a society
The
collapse of a society 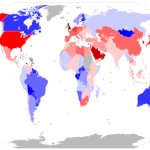 Slight Progress in the Global Ecological Footprint
 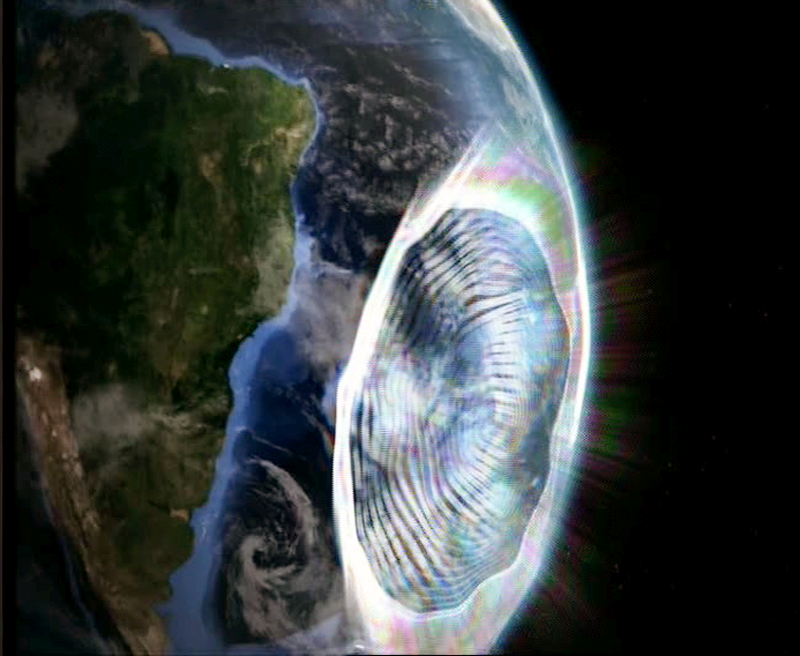 The South Atlantic Anomaly
  The phenomenon of soil sinking is called subsidence
 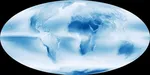 The disturbing cloud cover of the Earth
  The Planet's New Clouds
 Desertec: A Solar Dream for Europe and Africa