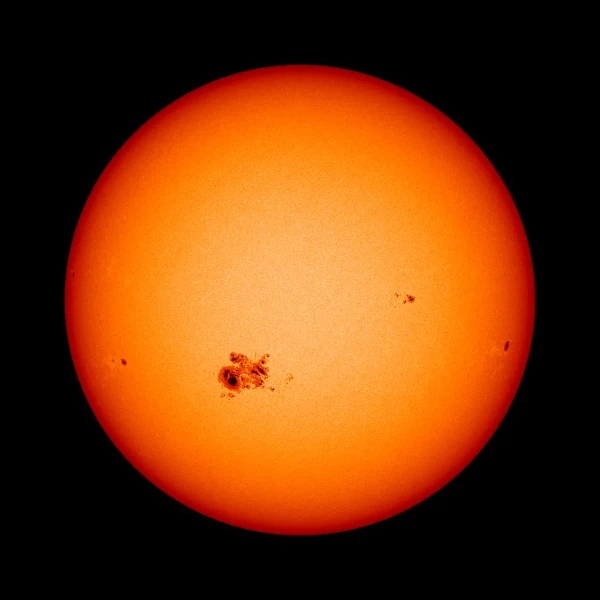
The Sun follows an approximately 11-year magnetic activity cycle, marked by variations in the number of sunspots. These spots, discovered by Galileo in 1610, appear as dark areas on the solar surface due to their lower temperature (about 3800 K compared to 5800 K for the surrounding photosphere).
Sunspots appear when intense magnetic fluxes emerge from the Sun's interior and pierce the photosphere, the visible layer of our star. These magnetic fields locally inhibit convection, reducing heat transport to the surface. As a result, the temperature in these regions drops by about 1500 K compared to the surrounding photosphere, making them visibly darker.
The mechanism behind this emergence is related to the solar dynamo, a complex process generated by the Sun's differential rotation and the turbulent movements of plasma in its convective zone. Magnetic field lines twist, tangle, and eventually reconnect or rise through the surface, forming coronal loops and sunspots.
Every 11 years or so, the Sun's magnetic field completely reverses: the north pole becomes the south pole and vice versa. This reversal marks the transition between two cycles and explains the gradual increase in solar activity toward a maximum (numerous sunspots, frequent flares, coronal mass ejections), followed by a return to the minimum (few or no sunspots, low activity).
The magnetic field density in a sunspot can reach up to \(\sim 0.3\,\text{Tesla}\), thousands of times stronger than Earth's magnetic field. These magnetic structures are often bipolar, with north and south polarities, illustrating their origin in magnetic flux tubes.
| Cycle | Period | Maximum Number of Spots | Duration (years) |
|---|---|---|---|
| Cycle 1 | 1755-1766 | 86.5 | 11.3 |
| Cycle 2 | 1766-1775 | 115.8 | 9.0 |
| Cycle 3 | 1775-1784 | 158.5 | 9.3 |
| Cycle 4 | 1784-1798 | 141.2 | 13.6 |
| Cycle 5 | 1798-1810 | 49.2 | 12.2 |
| Cycle 6 | 1810-1823 | 48.7 | 12.8 |
| Cycle 7 | 1823-1833 | 71.5 | 10.5 |
| Cycle 8 | 1833-1843 | 146.9 | 9.8 |
| Cycle 9 | 1843-1855 | 131.6 | 12.4 |
| Cycle 10 | 1855-1867 | 97.9 | 11.3 |
| Cycle 11 | 1867-1878 | 140.5 | 11.8 |
| Cycle 12 | 1878-1890 | 74.6 | 11.3 |
| Cycle 13 | 1890-1902 | 87.9 | 11.8 |
| Cycle 14 | 1902-1913 | 64.2 | 11.5 |
| Cycle 15 | 1913-1923 | 105.4 | 10.0 |
| Cycle 16 | 1923-1933 | 78.1 | 10.1 |
| Cycle 17 | 1933-1944 | 119.2 | 10.4 |
| Cycle 18 | 1944-1954 | 151.8 | 10.2 |
| Cycle 19 | 1954-1964 | 201.3 | 10.5 |
| Cycle 20 | 1964-1976 | 110.6 | 11.4 |
| Cycle 21 | 1976-1986 | 164.5 | 10.3 |
| Cycle 22 | 1986-1996 | 158.5 | 9.7 |
| Cycle 23 | 1996-2008 | 120.8 | 12.3 |
| Cycle 24 | 2008-2019 | 116.4 | 11.0 |
| Cycle 25 | 2019-2030 (predicted) | 115 (estimated) | 11 (estimated) |
Source: SILSO Sunspot Index and Long-term Solar Observations and NASA Solar Physics.
 The Sounds of Space: When Data Sings
  The Three-Body Problem: Three Celestial Bodies, One Law, Infinite Destinies
  Ptolemy's Almagest: What Remains 1900 Years Later?
  Lagrange Points: The Illusion of Stable Gravitational Oases
  Nemesis: The Theory of the Sun's Companion Star
  Solar System vs. Stellar Systems: A Comparison of Planetary Systems
  The Faint Young Sun Paradox: Why Wasn't Early Earth Frozen?
 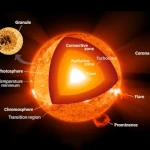 380 billion billion megawatts: The Solar Energy Excess
  The Ecliptic or the Apparent Orbit of the Sun
 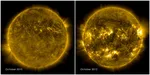 Solar maximum and minimum
 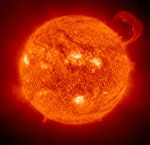 How to weigh the sun?
 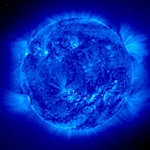 The Sun: When the Yellow Star Turns Blue
  Explanation of the 8 of the analemma
  Frost Line: The Boundary That Shaped the Planets
  Tourist trip in the solar system
 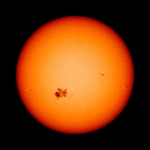 Sunspots and the Solar Cycle: From Minimum to Maximum
 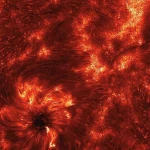 The infernal journey of the photon or random walk
 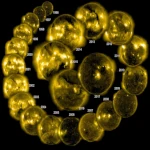 Dynamics of Solar Cycles and Physical Mechanisms of Solar Flares
  Baily grains in a solar eclipse
 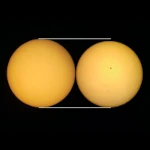 Birth, Life and Death of the Sun: Chronicle of an Average Star
  Grains of Baily or pearls of light
 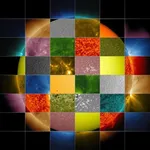 Sunlight and wavelengths
 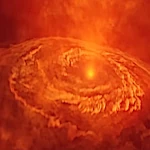 The chaotic formation of the solar system
 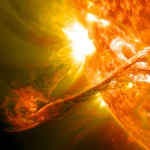 Solar Storms and Catastrophic Scenarios
 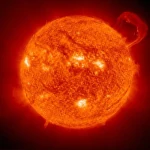 Solar Prominences: Filaments of Matter in the Solar Atmosphere
  Why Does the Sun Rotate So Slowly? The Mystery of the Missing Angular Momentum
  Solar Winds: A Key Phenomenon of Interplanetary Space
  Heliosphere: At the Borders of the Solar System
 Chaos and sensitivity to initial conditions
  Stability and Chaos: Limits of the Solar System’s Orbital Harmony